Canopy Dashboard
The Canopy Dashboard is the admin landing screen: a rolling 30-day snapshot of your organization with KPI cards, recent users, and customer-health signals.
Overview
Section titled “Overview”The Dashboard is the screen you land on when you sign in to Canopy. It opens at /home and gives you a 30-day snapshot of your organization: how many customers and users you have, which models are in use, who has been active recently, and which child tenants need attention.
Everything on the Dashboard reflects the trailing 30 days unless a card says otherwise, so it is the fastest way to see the current state of your organization before you drill into a specific area.
KPI cards
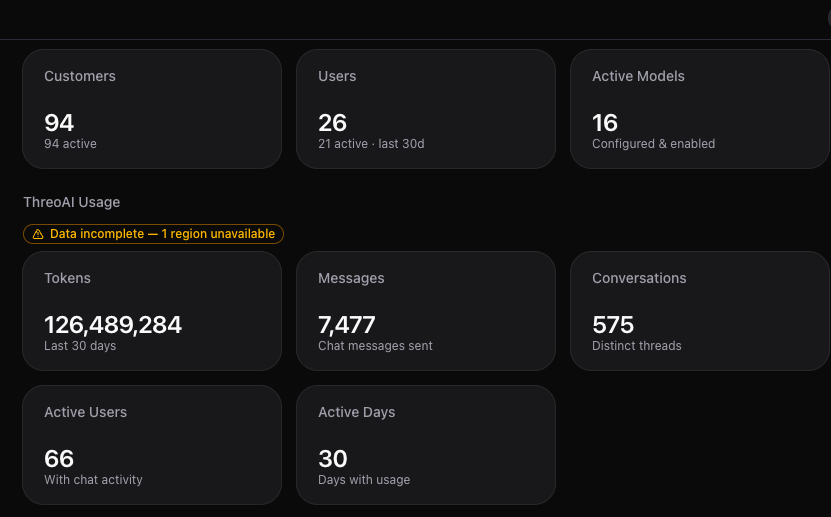
Section titled “KPI cards”The top of the Dashboard is a row of KPI cards. Each card is one headline metric for the last 30 days.
| Card | What it shows |
|---|---|
| Customers | The number of child customer tenants under your organization |
| Users | The number of user accounts across your organization |
| Active models | The GPT models configured and enabled for your organization |
Use the cards as a pulse check. A sudden change, such as a drop in active users or a jump in customers, is your cue to open the matching section for detail.
Recent users
Section titled “Recent users”Below the KPI cards, the Recent users list shows the users who were most recently added or active. It is a quick entry point into User Management: select a user to review their permissions, resend a welcome email, or adjust their roles.
Customer health
Section titled “Customer health”The Customer health table lists your child customer tenants alongside the signals that tell you which ones need attention. Each row is one customer, and the columns flag tenants that may be at risk, under-adopted, or otherwise worth a closer look.
Select a customer to jump to its detail page in Customers, where you can review its users, features, and settings. For the deeper usage and adoption metrics behind these signals, open Analytics.
Switch into a customer
Section titled “Switch into a customer”The Dashboard offers a one-click way to step into a child customer’s environment. This uses Delegate Login, the same mechanism described in Sign In As and Delegate Login, to open the child tenant in Canopy or Builder with delegated access.
Frequently Asked Questions
Section titled “Frequently Asked Questions”What period does the Dashboard cover? The Dashboard summarizes the trailing 30 days. KPI cards and recent-activity lists reflect that rolling window unless a card states otherwise.
How is Active models counted? Active models counts the GPT models your organization had available and in use during the last 30 days. Models that exist but were not used in the window are not counted.
Can customers see my Dashboard? No. The Dashboard is administrator-only inside Canopy. Child customers never see your organization’s Dashboard, KPIs, or customer-health data.
Related
Section titled “Related”- Canopy Analytics - usage and adoption KPIs in depth
- Adding a New Customer - create and manage child customer tenants
- Sharing - decide who can use which agents, models, and resources
- Canopy Overview - the admin portal at a glance