Canopy Analytics
Canopy Analytics gives usage and adoption KPIs across your organization. Track active customers, adoption, and at-risk signals by period and customer.
Overview
Section titled “Overview”Analytics gives you usage and adoption KPIs across your whole organization. It opens at /analytics and answers the questions an MSP cares about: who is actually using the platform, which customers are growing, and which ones are slipping. You can scope every figure by period and by individual customer.
Where the Dashboard is a quick 30-day pulse, Analytics is where you track value over time and per account.
Overview tab
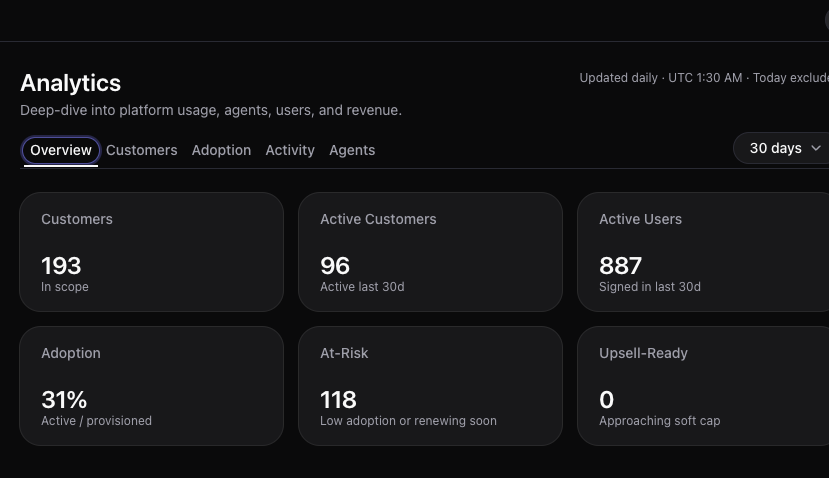
Section titled “Overview tab”The Overview tab is where MSP value-tracking lives. Each metric is one row with a concrete, plain-language meaning.
| Metric | What it measures |
|---|---|
| Customers | The total number of child customer tenants in scope |
| Active Customers | Customers with recorded usage during the selected period |
| Active Users | Users who used the platform during the selected period |
| Adoption | The share of your provisioned users or customers that are actually active - how widely the platform has taken hold |
| At-Risk | Customers flagged by low adoption or an approaching renewal, who may need attention before they churn |
| Upsell-Ready | Customers approaching their plan’s soft cap, flagged as good candidates for more seats, products, or features |
Read these together: rising Adoption with a growing Upsell-Ready count is healthy expansion; a climbing At-Risk count is your early warning to step in.
Adoption tab
Section titled “Adoption tab”The Adoption tab breaks user counts down by type so you can tell provisioned seats from real engagement.
| Count | What it includes |
|---|---|
| Total | Every user account in scope, active or not |
| Active | Users who used the platform during the selected period |
| Guest | Users invited as guests rather than full members of your organization |
The gap between Total and Active is the clearest read on under-adoption: a large gap means seats are provisioned but not being used.
Scoping the view
Section titled “Scoping the view”Two controls shape what every metric reflects:
- Period selector - choose the time window. All KPIs recalculate for that window, so “Active” always means active within the period you picked.
- Per-customer scoping - narrow the view to a single child customer, or leave it org-wide.
Read org-wide figures for the health of your whole book of business, then scope to one customer to investigate a specific At-Risk or Upsell-Ready signal before you act on it.
Frequently Asked Questions
Section titled “Frequently Asked Questions”What does At-Risk mean? At-Risk flags customers with low adoption or an upcoming renewal, signalling the account may need attention before it churns.
What counts as an Active User? An Active User is a user who used the platform during the selected period. Accounts that exist but were not used in the window count toward Total but not Active.
What is Upsell-Ready? Upsell-Ready flags customers approaching their soft cap, marking them as good candidates for additional seats, products, or features.
How current is the data? Analytics refreshes once a day at 01:30 UTC and excludes the current day, so today’s activity appears after the next refresh.
Related
Section titled “Related”- Canopy Dashboard - the 30-day organization snapshot
- Adding a New Customer - create and manage child customer tenants
- Sharing - decide who can use which agents, models, and resources
- Canopy Overview - the admin portal at a glance