Builder Debugger
Builder Debugger guide - use the visual step-through debugger to inspect node inputs and outputs, trace data flow, and diagnose issues in AI agent workflows.
The Debugger in Builder is a troubleshooting tool that allows you to inspect and understand what happened during a workflow run.
It provides visibility into each node’s triggered actions, the data passed between them, and additional execution details - helping you pinpoint issues or verify behavior.
Purpose
Section titled “Purpose”- Review the latest values processed by each node
- Inspect the input data received by nodes
- See detailed execution logs and messages for each triggered node
How to Access the Debugger
Section titled “How to Access the Debugger”- Open Builder and load the workflow you want to inspect
- Click the Test button in the top toolbar to manually execute the workflow
- The Debugger tab is only available after a manual execution
- In the Test Results panel, click the Debugger tab
- The Debugger view will display all nodes that were triggered during the run
Understanding the Debugger View
Section titled “Understanding the Debugger View”The Debugger contains two main tables:
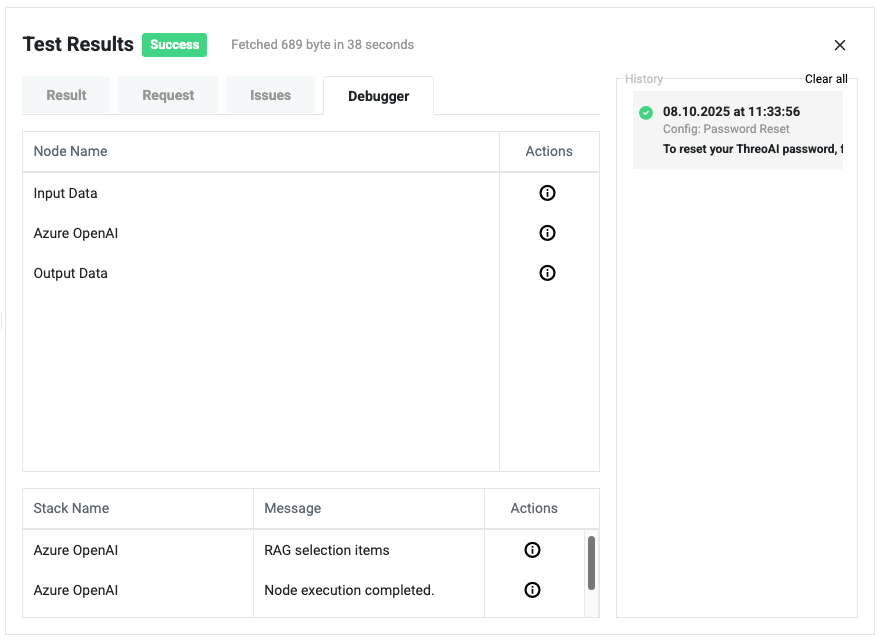
Node Execution Table
Section titled “Node Execution Table”Shows all nodes that were triggered in the workflow.
| Column | Description |
|---|---|
| Node Name | The name of the triggered node |
| Actions | Click the icon to view the input data that the node received |
Example:
- Input Data - Shows the initial data passed into the workflow
- Azure OpenAI - Displays the prompt or parameters sent to the model
- Output Data - Shows the final processed data before workflow completion
Node Details Table
Section titled “Node Details Table”Displays additional execution messages for each node.
| Column | Description |
|---|---|
| Stack Name | The node name where the message originated |
| Message | Details about the node’s execution |
| Actions | Click the icon to view more context or raw data |
Example:
- Azure OpenAI - RAG selection items: Shows the records chosen by the Retrieval-Augmented Generation process based on its understanding
- Azure OpenAI - Node execution completed: Confirms successful execution
Step-by-Step: Using the Debugger
Section titled “Step-by-Step: Using the Debugger”- Run a test execution - click Test in the agent toolbar and enter a sample input message or submit the form. The workflow executes and results appear in the Test Results panel.
- Open the Debugger tab - click the Debugger tab in the Test Results panel. The Node Execution Table lists every node that ran during this execution.
- Expand a node’s input - click the action icon next to any row to see the exact data that node received. This is the raw JSON payload passed in from the previous node. Compare this against what you expected the upstream node to produce.
- Read the Node Details table - scroll down to the Node Details table. Each row is an execution message from a node. For LLM nodes, look for “RAG selection items” to see which knowledge base chunks were retrieved, and “Node execution completed” to confirm successful execution.
- Drill into raw data - click the action icon in the Node Details table to open the full raw data payload for a message. This is especially useful for inspecting LLM responses, tool call structures, and RAG retrieval results.
- Compare the canvas against the Debugger list - verify that every node you expect to have run appears in the Node Execution Table. Missing nodes indicate a skipped or disconnected node (see troubleshooting below).
Reading Variable Output by Node Type
Section titled “Reading Variable Output by Node Type”Different node types produce different output shapes. The following describes what to look for in the Debugger for common node types.
Input Data node
Section titled “Input Data node”The Input Data node output is typically a JSON object with a userSays key containing the user’s message, or a structured JSON payload if the agent is triggered by a schedule or API call. When a form is submitted, the object also contains each form field value keyed by its field name.
Example Debugger output for a chat-triggered agent:
{ "userSays": "What is the refund policy?"}Example Debugger output when a form was submitted with a customer_id field:
{ "userSays": "", "customer_id": "CUST-00412", "issue_type": "billing"}LLM node (OpenAI GPT / unified LLM)
Section titled “LLM node (OpenAI GPT / unified LLM)”The LLM node output is a JSON object whose top-level key matches the Output Column Name you configured (default: gpt_response). Inside that key, the main text response is the string value. If Omit Full Response is disabled, the full API response object is also present, including tool_calls for function-calling workflows.
In the Node Details table, look for the RAG selection items message when RAG is configured. Expanding this entry shows the exact knowledge base chunks that were retrieved and injected into the prompt. Review these chunks to understand why the model gave a particular answer - if the wrong chunks are being retrieved, adjust the confidence threshold or Top N contexts in the LLM node’s RAG Inference Settings.
Output Data node
Section titled “Output Data node”The Output Data node shows the rendered template string - the final text that was returned to the user. If this is blank or shows raw template syntax (for example {{Out.gpt_response}} instead of the actual text), the variable reference is not resolving correctly. Check that the upstream node’s Output Column Name exactly matches what you typed in the template.
Custom Script node
Section titled “Custom Script node”The Custom Script node output appears as the JSON object returned by the execute function. The top-level key is whatever unique wrapper name you used in the script (for example custom_result). If the node fails, the Node Details table will show an error message with the Python traceback, which is the fastest way to identify a script error.
Send Email node
Section titled “Send Email node”The Send Email node outputs a status object indicating whether the email was sent. If the email was not delivered, the Node Details table shows the error. Common causes are invalid SMTP credentials, a blocked port, or a malformed recipient address. Check the raw input to the Send Email node in the Debugger to verify the toEmail and body variables resolved correctly - a stray Mustache reference that did not resolve will appear as literal {{...}} text in the body.
HTTP Client node
Section titled “HTTP Client node”The HTTP Client node output contains the response from the external API call, including status code and body. If the call failed, inspect the Node Details entry for the HTTP status code and error message. Check the raw input to confirm that URL, headers, and body variables all resolved to the expected values before the request was sent.
Tool Eval node
Section titled “Tool Eval node”The Tool Eval node only appears in the Debugger if the upstream LLM node called the function whose name matches the Tool Eval node’s Match Function Name. If you expected a particular Tool Eval node to run but it is absent from the Debugger list, the LLM did not call that function. Inspect the LLM node’s raw output in the Debugger - the tool_calls array in the full response shows which function was actually called. Adjust your system message or tool schema if the wrong function is being selected.
Common Debugging Patterns
Section titled “Common Debugging Patterns”Missing node in Debugger output
Section titled “Missing node in Debugger output”If a node is visible on the canvas but does not appear in the Debugger after a test run, it was skipped by the engine. Common causes:
- Layer desync: The node exists in the canvas (ReactFlow layer) but is missing or has a mismatched ID in the underlying
modelJson(engine layer). Export the agent JSON and verify both layers contain the same node IDs. - No incoming edge: The node is not connected to any upstream node, so the engine never reaches it.
- Conditional branch not taken: A Tool Eval upstream routed data to a different branch.
Blank or unexpected output
Section titled “Blank or unexpected output”- Variable name mismatch: Check that the Output Column Name on the upstream node matches the
{{Out.variable_name}}reference exactly (case-sensitive). - Curly brace crash: If an LLM node returns content containing
{{or}}, downstream template rendering may crash silently. Inspect the LLM node’s raw output in the Debugger for stray curly braces. - fullResponseOmit not set: If
gpt_full_response(a large JSON object) is polluting downstream output, enable Omit Full Response on the LLM node’s Output section.
Credential failures
Section titled “Credential failures”Nodes with missing or invalid credentials fail silently - no error appears on the canvas. The Debugger’s Node Details table will show an execution error message for the affected node. After cross-agent imports, always re-attach credentials in the configuration drawer.
RAG retrieval quality issues
Section titled “RAG retrieval quality issues”When an LLM node with RAG configured returns irrelevant or incomplete answers, the Debugger is the fastest diagnostic tool:
- Expand the LLM node in the Node Execution Table and check the input - confirm the user’s question arrived correctly.
- In the Node Details table, find the RAG selection items message for that node and expand it.
- Review the retrieved chunks. Ask: are these chunks actually relevant to the question? Do they contain the information needed to answer it?
- If chunks are irrelevant, the confidence threshold may be too low - raise it to filter out low-relevance matches.
- If no chunks are retrieved (or very few), the confidence threshold may be too high, or the knowledge base may not contain content matching the query. Lower the threshold or add more relevant documents to the knowledge base.
- If the right content is in the knowledge base but not being retrieved, the embedding model or training style may not be a good match for the content type. See RAG Best Practices for guidance on retraining.
Send Email or Output Data rendering issues
Section titled “Send Email or Output Data rendering issues”When the rendered output contains literal {{...}} syntax instead of resolved values, or when an email body looks wrong:
- Open the upstream node’s entry in the Node Execution Table and expand its output. Confirm the field you are referencing actually exists in the output object and is spelled correctly.
- Check case sensitivity -
{{Out.gpt_response}}and{{Out.GPT_Response}}are different. - If the LLM output contains JSON and you are trying to reference a field within it, confirm the LLM node is configured with Response Format: JSON Object and that the output is being parsed correctly before the reference.
Example Usage
Section titled “Example Usage”- Verifying Data Flow - Check exactly what data each node received during execution
- Inspecting AI Behavior - Review RAG selection items to understand why certain records were chosen
- Debugging Errors - Identify which node failed and inspect its input to find the cause
Best Practices
Section titled “Best Practices”- Always run the workflow manually via Test before opening the Debugger
- Use the icon to drill down into node inputs and execution details
- Review both tables to get a complete picture of the workflow’s behavior
- When testing AI nodes, pay attention to RAG selection details for accuracy checks
- Compare the Debugger’s node list against the canvas to detect layer desync (nodes visible on canvas but not executed)
- When debugging Send Email or Output Data rendering issues, inspect the raw output of the upstream node for Mustache template conflicts